

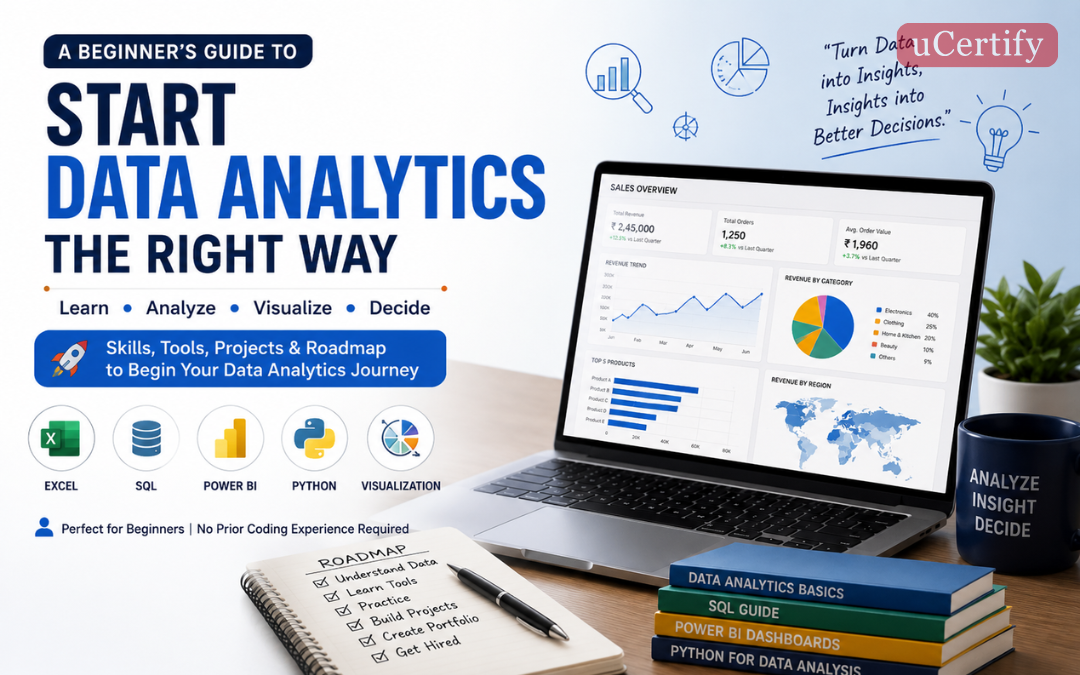
Learning data analytics can feel confusing at first. Search for a beginner course and you will quickly run into Excel, SQL, Python, Power BI, Tableau, statistics, machine learning, cloud platforms, certifications, and dozens of different career roadmaps.
Here is the part that often gets lost: you do not need to learn all of those things before you can start analyzing data.
If you are looking for a practical way to begin Data Analytics for Beginners, focus first on understanding data and solving simple problems. Once the basics become comfortable, the tools start making much more sense.
By the end of this guide, you should know what data analytics actually involves, which skills to learn first, how the major tools fit together, how to practice with projects, and what it takes to move toward a data analyst career.
What Is Data Analytics?
Data analytics is the process of examining data to answer questions, identify patterns, measure performance, and support decisions.
Imagine an online store with 50,000 orders. The company has plenty of information, but simply having a large spreadsheet does not tell management what to do next.
An analyst might investigate questions such as:
- Which products generate the most revenue?
- Which regions are growing or declining?
- Are customers returning after their first purchase?
- Did sales fall because fewer customers purchased, or because customers spent less?
- Which marketing campaign produced the strongest results?
- Are certain products frequently returned?
Notice the difference between looking at data and analyzing data.
Looking at data tells you what exists. Analysis tries to explain what is happening and why it matters.
That distinction is at the heart of the profession.
How Data Analytics Actually Works
Before learning individual tools, it helps to understand the typical analytics workflow.
A simple version looks like this:
Business question → Data collection → Data cleaning → Exploration → Analysis → Visualization → Insight → Recommendation
Suppose a retailer says:
“Our sales dropped last quarter. What happened?”
The analyst does not immediately open Power BI and start building charts.
First, the question needs to be clarified. What does “sales dropped” mean? Total revenue? Number of orders? Average order value? A particular region or product category?
Next comes the data. The analyst may need sales transactions, product information, customer records, and regional details.
The data then needs to be checked. Missing values, duplicate orders, inconsistent dates, or incorrect product categories can distort the result.
Only after that does the actual analysis begin.
This is why learning data analytics tools without understanding the analytical process can leave beginners with technical skills but weak problem-solving ability.
Why Learn Data Analytics?
Organizations collect information from almost every part of their operations. Sales systems record transactions. Websites record user activity. Marketing platforms measure campaigns. Finance teams track revenue and expenses. Operations teams monitor inventory and performance.
Someone has to turn all of that information into something useful.
That creates opportunities across industries. Retail companies analyze purchasing behavior. Financial organizations study transactions and risk. Healthcare organizations use analytics to understand operations and patient-related trends. Technology companies examine product usage and customer behavior.
There is another reason beginners are attracted to analytics: the field combines technical and business thinking.
You can enjoy working with numbers and technology without spending your entire day building software applications.
However, it is worth keeping expectations realistic. Knowing Excel or Power BI alone does not automatically make someone an analyst. Employers need people who can investigate a question, work with imperfect data, recognize misleading results, and explain what the findings mean.
How to Start Data Analytics
If you are wondering how to start data analytics, avoid building a giant list of technologies and trying to learn them simultaneously.
A more practical sequence is:
Data fundamentals → Excel → SQL → Statistics → Data visualization → Power BI or Tableau → Python → Projects → Portfolio
The order is not a strict law. Some learners may introduce SQL earlier, while others may start Python sooner. What matters is developing skills that build on one another.
The goal is not to collect software names.
The goal is to become someone who can take a question and use data to produce a defensible answer.
Step 1: Learn How Data Is Structured
Before working with tools, learn to recognize what is inside a dataset.
A dataset may contain numerical values, categories, dates, text, identifiers, and other fields. You should understand concepts such as rows, columns, variables, records, data types, missing values, duplicates, outliers, and relationships between tables.
Consider this small customer dataset:
| Customer ID | Age | City | Purchase Amount |
| 101 | 24 | Delhi | ₹2,500 |
| 102 | 31 | Mumbai | ₹4,200 |
| 103 | 27 | Pune | ₹1,800 |
A beginner may immediately calculate the average purchase amount.
An analyst asks a few questions first.
Are all three customers unique? Are any purchase values missing? Is ₹4,200 a normal transaction or an unusually large one? Are there duplicate transactions elsewhere in the dataset?
That habit is more valuable than memorizing another function.
Reliable analysis starts with understanding the quality and structure of the data.
Step 2: Learn Excel for Data Analytics
Excel is a sensible starting point for many beginners because it lets you work directly with data while learning the basic logic of analysis.
Start with functions such as:
SUM, AVERAGE, COUNT, COUNTIF, SUMIF, IF, XLOOKUP, INDEX, and MATCH.
Then learn how to:
- Sort and filter data
- Identify and remove duplicates
- Handle basic data-cleaning tasks
- Use PivotTables
- Create charts
- Apply conditional formatting
- Build simple dashboards
Imagine receiving 20,000 sales records and being asked which region produced the most revenue.
You could clean the dataset, create a PivotTable, group sales by region, calculate totals, and visualize the result.
That is already a meaningful analytics exercise.
The next question should be harder:
Why did one region perform better than the others?
That is where analysis starts moving beyond spreadsheet manipulation.
Step 3: Learn SQL for Data Analytics
SQL should be a major part of your data analytics roadmap.
SQL, or Structured Query Language, allows analysts to retrieve and work with information stored in relational databases.
Start with:
SELECT, WHERE, ORDER BY, GROUP BY, HAVING, JOIN, CASE, and aggregate functions.
Once those become comfortable, move toward subqueries, Common Table Expressions, and window functions.
The important thing is to learn SQL through questions.
For example:
Which products generated more than ₹100,000 in sales?
A slightly more realistic question might be:
Which customers placed an order in the previous quarter but have not purchased during the current quarter?
Now the task involves dates, customer history, and potentially multiple tables.
This is where SQL becomes more than syntax practice.
Why JOINs Matter
Real business data is often divided across tables.
You might have one table for customers, another for orders, and another for products.
For example:
Customers
| Customer ID | Customer Name | City |
| 101 | Asha | Delhi |
| 102 | Rahul | Mumbai |
Orders
| Order ID | Customer ID | Amount |
| 5001 | 101 | ₹2,500 |
| 5002 | 102 | ₹4,200 |
A JOIN allows you to connect those tables and answer questions that neither table can answer alone.
This is one reason SQL is such an important data analyst skill.
Step 4: Build a Foundation in Statistics
You do not need advanced mathematics to begin data analytics, but statistics helps you avoid incorrect conclusions.
Start with:
- Mean
- Median
- Mode
- Range
- Variance
- Standard deviation
- Percentages
- Percentiles
- Correlation
- Probability
- Sampling
The important part is not simply calculating these values.
It is knowing what they mean.
Suppose five customers spend:
₹500, ₹600, ₹700, ₹800, ₹10,000
The average is heavily influenced by the ₹10,000 purchase.
The median gives a different picture of a typical customer.
This simple example demonstrates why an analyst should not blindly report the first number produced by a calculation.
You should also understand correlation versus causation.
If advertising spending increases during the same period that sales increase, that does not automatically prove that advertising caused every additional sale. Other factors may have changed at the same time.
That kind of caution is part of good analysis.
Step 5: Learn Data Visualization
A useful analysis can still fail if nobody understands the result.
That is why data visualization matters.
A visualization should answer a question, highlight a pattern, or make comparison easier.
For example:
- Use a line chart when you need to show a trend over time.
- Use a bar chart when comparing categories.
- Use a scatter plot when exploring relationships between numerical variables.
- Use a map when geographic location is genuinely important.
The purpose is not to fill a dashboard with charts.
Suppose monthly revenue has fallen steadily for six months. A simple line chart can make that trend obvious.
Now imagine a dashboard with 20 different charts, bright colors, multiple filters, and no clear explanation of what management should notice.
It may look impressive, but it may be less useful.
Good visualization reduces the effort required to understand the data.
Step 6: Choose Power BI or Tableau
Once you understand basic visualization, choose one major business intelligence platform.
Power BI is a practical option for learners who want to work within the Microsoft ecosystem.
Tableau is another widely used platform for interactive dashboards and visual analytics.
You do not need to master both on day one.
Choose one and learn how to:
- Import data
- Clean and transform data
- Create relationships
- Build calculated measures or fields
- Create visualizations
- Add filters
- Design dashboards
- Present findings
After you understand the concepts, moving between visualization platforms becomes considerably easier.
The transferable skill is not memorizing where every button is located. It is knowing what the visualization should communicate.
Step 7: Add Python for Data Analytics
Python is useful, but it does not have to be your first stop.
For many beginners, Excel and SQL provide a more comfortable introduction to analytical thinking.
Later, Python became particularly useful for automation, larger datasets, repeated workflows, and more advanced analysis.
For Python for data analytics, begin with:
- Python fundamentals
- Variables and data structures
- Functions
- Loops
- Pandas
- NumPy
- Matplotlib
- Data cleaning
- Exploratory data analysis
You do not need to become a professional software developer.
Suppose you receive the same type of sales file every Monday. A Python script could automate repetitive cleaning and transformation tasks.
That is a practical reason to learn Python: it can reduce repetitive work and expand what you can do with data.
Which Data Analytics Tools Should You Learn First?
There is no universal tool stack. Your target role, industry, and existing experience can influence the answer.
For a beginner, however, this is a reasonable starting point:
| Skill | Recommended Tool | Priority |
| Spreadsheet analysis | Excel | Very High |
| Database querying | SQL | Very High |
| Business intelligence | Power BI or Tableau | High |
| Basic statistics | Excel / Python | High |
| Programming and automation | Python | Medium–High |
| Advanced analytics | Python / R | Later |
One piece of advice is worth remembering:
Depth beats tool collecting.
Being able to complete a useful analysis in Excel, SQL, and one BI platform is more valuable than having ten tools listed on your resume that you can barely use.
Learn by Building Data Analytics Projects
Tutorials have their place, but analytics is learned through practice.
After learning a concept, use it.
Start with manageable data analytics projects, such as:
E-commerce Sales Analysis
Analyze orders, products, customers, revenue, and regions.
Possible questions:
- Which products sell the most?
- Which region generates the highest revenue?
- What is the average order value?
- Which customers purchase repeatedly?
- Are sales seasonal?
Marketing Campaign Analysis
Compare campaign spending, clicks, conversions, and customer acquisition.
The goal is not merely to identify the campaign with the most clicks. A campaign can generate many clicks and still perform poorly if very few users convert.
Employee Data Analysis
Explore departments, experience, salary ranges, and employee turnover.
Instead of simply showing average salary, investigate whether patterns differ across departments or experience levels.
Public Dataset Analysis
Public datasets are useful because they expose beginners to information that is less carefully prepared than tutorial datasets.
That matters.
Real-world data is rarely as clean as the examples in a beginner course.
A Complete Beginner Data Analytics Project
Here is a project you can actually use as a learning exercise.
Business Problem
An online retailer reports that quarterly revenue has fallen by 12%.
Management wants to know why.
Step 1: Define the Question
Do not start with charts.
Break the problem into smaller questions:
- Did the number of orders decline?
- Did the average order value decline?
- Did a specific region perform poorly?
- Did certain products lose demand?
- Did returning customers purchase less frequently?
Step 2: Inspect the Data
Suppose you have:
- Order ID
- Customer ID
- Order date
- Product
- Category
- Region
- Quantity
- Revenue
Check for missing values, duplicate order IDs, invalid dates, and unusual revenue values.
Step 3: Analyze
Use SQL or Excel to calculate:
Revenue = Sum of sales
Average Order Value = Total Revenue ÷ Number of Orders
Then compare these measures with the previous quarter.
Step 4: Visualize
Create a small dashboard showing:
- Monthly revenue
- Revenue by region
- Revenue by category
- Number of orders
- Average order value
Step 5: Interpret
Imagine the analysis shows that order volume remained almost unchanged, but average order value fell sharply in two regions.
That changes the investigation.
The problem may not be customer traffic. It may be product mix, pricing, discounts, or purchasing behavior.
Step 6: Recommend
A useful conclusion might be:
“The revenue decline is concentrated in two regions and is primarily associated with lower average order value rather than fewer orders. The next investigation should focus on product mix, discounting, and customer purchasing patterns in those regions.”
That is what a good beginner project should demonstrate.
Not just charts.
Reasoning.
Build a Data Analytics Portfolio
Once you have completed a few projects, organize them into a portfolio.
Three strong projects are generally more useful than ten unfinished tutorial exercises.
For every project, explain:
Problem → Dataset → Cleaning → Tools → Analysis → Findings → Recommendation
Do not simply write:
“Created a Power BI dashboard.”
Explain what the dashboard helped reveal.
For example:
“Built a sales dashboard to identify regional revenue changes and investigate the causes of declining average order value.”
That tells a much better story.
A hiring manager should be able to understand your contribution without reading technical documentation for twenty minutes.
Communication Is a Data Analyst Skill Too
Imagine discovering an important pattern after three hours of analysis.
Then imagine explaining it to a manager using fifteen technical terms and six complicated charts.
The analysis may be correct, but the communication has failed.
Practice turning technical findings into plain language.
Instead of:
“The regression coefficient indicates…”
explain the practical meaning of the result.
For example:
“Customers who purchased this product category were more likely to return within 30 days.”
A strong analyst should be comfortable moving between data and conversation.
You may need to discuss findings with marketing teams, finance teams, product managers, operations teams, or senior leadership. Each audience may need the same analysis explained differently.
A Practical Data Analytics Roadmap
If you want a simple data analytics roadmap, use the following as a starting framework.
Month 1: Data Fundamentals and Excel
Learn how datasets are structured. Practice cleaning, filtering, formulas, PivotTables, and basic charts.
Month 2: SQL
Learn querying, filtering, aggregation, JOINs, CASE statements, and increasingly complex questions.
Month 3: Statistics and Visualization
Learn descriptive statistics and start building meaningful visualizations.
Month 4: Power BI or Tableau
Choose one BI platform and create dashboards using datasets you have already analyzed.
Month 5: Python
Learn Python fundamentals and use Pandas for data manipulation and exploratory analysis.
Month 6: Projects and Portfolio
Build two or three complete projects. Document the problem, process, findings, and recommendations.
This is not a promise that you will become job-ready in exactly six months. Your previous experience, study time, and target role all matter.
Think of the timeline as a learning framework, not a deadline.
Common Mistakes Beginners Make
Trying to Learn Every Tool
Excel, SQL, Python, Power BI, Tableau, R, cloud platforms, machine learning, and AI can quickly become an endless checklist.
You do not need all of them.
Choose a core stack and become useful with it.
Watching Tutorials Without Practicing
Finishing a tutorial can feel like progress.
But the real test is what happens when the instructions disappear.
Can you open an unfamiliar dataset and decide what to investigate?
If not, you need more practice.
Ignoring Data Cleaning
A beautiful dashboard built from incorrect data is still incorrect.
Check missing values, duplicates, inconsistent categories, date formats, and suspicious records before trusting your analysis.
Confusing Correlation With Causation
Two variables moving together does not automatically mean one caused the other.
This mistake can lead to confident but incorrect business recommendations.
Building Dashboards Instead of Answers
A dashboard is a communication tool.
It is not the analysis itself.
Start with the question and choose the visualization afterward.
Focusing Only on Technical Skills
SQL and Python are valuable, but communication, critical thinking, business understanding, and curiosity also matter.
A technically strong analyst who cannot explain the result will struggle to create impact.
Do You Need a Degree to Start Data Analytics?
A degree can be valuable for many careers and may be preferred for some positions, but it is not the only way to demonstrate analytics ability.
Projects, internships, work experience, certifications, and a strong portfolio can provide evidence of practical skills.
If you are changing careers, think about what you can show, not just what you can list.
A resume can say:
“SQL — Intermediate.”
A portfolio can demonstrate it.
That distinction is important.
Should You Get a Data Analytics Certification?
A data analytics certification can give your learning a structured path and may help demonstrate knowledge in a specific area.
But certification should support practical learning rather than replace it.
A stronger combination is:
Learning + hands-on practice + certification + projects + portfolio
Before choosing a certification, examine its curriculum, assessment style, practical components, and relevance to the role you want.
Do not choose a certification simply because its title contains the words “data analytics.”
Choose one that helps close an actual skill gap.
What Careers Can You Pursue After Learning Data Analytics?
Data analytics can lead to several different career paths.
Entry-level or related roles may include:
- Data Analyst
- Business Analyst
- Marketing Analyst
- Operations Analyst
- Financial Analyst
- Product Analyst
- Reporting Analyst
- BI Analyst
Your direction can change as your interests develop.
Someone who enjoys business problems may move toward business analytics. Someone who enjoys statistics and programming may eventually explore data science. Someone interested in dashboards and reporting may move deeper into business intelligence.
There is no requirement to decide your entire career before learning your first SQL query.
Where Does AI Fit Into Data Analytics?
AI is becoming another tool in the analyst’s toolkit.
It can help generate SQL drafts, explain formulas, suggest code, summarize information, or provide ideas for exploratory analysis.
But there is an important catch.
AI-generated output still needs to be checked.
Imagine asking an AI tool to create a SQL query involving three tables. The query may look perfectly reasonable while producing incorrect results because of an inappropriate JOIN.
An analyst who understands the underlying logic can identify the problem.
That is why AI makes fundamental skills more valuable, not necessarily less valuable.
The best approach is to use AI to accelerate parts of your workflow while keeping responsibility for the final analysis.
What Should You Learn First?
If you are starting from zero, keep your first learning stack simple:
1. Data fundamentals
Understand datasets, data types, quality issues, and basic analytical thinking.
2. Excel
Learn spreadsheet analysis and become comfortable manipulating data.
3. SQL
Learn how to retrieve and combine information from databases.
4. Statistics
Understand how to interpret numbers rather than simply calculate them.
5. Power BI or Tableau
Learn to communicate findings visually.
6. Python
Add automation and more advanced analytical capabilities when you are ready.
Then build projects.
This sequence is not the only possible path, but it prevents one of the most common beginner problems: spending months learning tools without producing anything.
Beginner Data Analytics Checklist
Before calling yourself comfortable with the fundamentals, see whether you can do the following:
- Understand the structure of a dataset
- Identify missing and duplicate data
- Clean basic datasets
- Use Excel formulas and PivotTables
- Write basic SQL queries
- Use JOINs to combine related tables
- Calculate and interpret basic statistics
- Choose an appropriate chart
- Build a simple Power BI or Tableau dashboard
- Explain an insight in plain language
- Complete at least two independent projects
- Document your work in a portfolio
If several boxes are still unchecked, that is not a problem.
It simply tells you what to practice next.
Your First Week of Data Analytics
If you are unsure where to begin today, make the first week deliberately simple.
Day 1: Find a small sales dataset and understand its columns.
Day 2: Clean missing values and duplicates.
Day 3: Calculate revenue, order count, and average order value.
Day 4: Create three useful charts.
Day 5: Write five questions about the data and answer them.
Day 6: Present your findings in a one-page report or dashboard.
Day 7: Review your work and identify one thing you would investigate further.
You will learn more from completing that small exercise than from creating another twenty-item course bookmark list.
Final Thoughts
Starting Data Analytics for Beginners does not require mastering every tool in the industry.
Start by understanding the data itself. Learn Excel, move into SQL, develop basic statistical thinking, and become comfortable presenting information visually. Once those foundations are in place, Power BI, Tableau, Python, and more advanced techniques become easier to approach.
Most importantly, practice solving problems.
Do not judge your progress by the number of tutorials completed or certificates collected. Ask a better question:
Can I take unfamiliar data, investigate a meaningful problem, find a reliable pattern, and explain what someone should do about it?
If the answer gradually becomes yes, you are moving in the right direction.
Data analytics is not really about producing more numbers.
It is about making better sense of the numbers you already have.
Start with one dataset. Ask one useful question. Find one defensible answer. Then do it again.
Frequently Asked Questions
Is data analytics difficult for beginners?
It can take time to develop confidence, but beginners do not need advanced mathematics or programming to start. A practical entry point is data fundamentals, Excel, SQL, statistics, and visualization.
How long does it take to learn data analytics?
There is no fixed timeline. Your previous experience, study schedule, and target role all affect how quickly you progress. A few months of consistent practice can establish a strong foundation, but becoming job-ready requires projects and continued practice.
Should I learn Excel or Python first?
For many complete beginners, Excel is an easier place to start because it lets you focus on data manipulation without learning programming at the same time. Python can be added later for automation and more advanced analysis.
Is SQL necessary for a data analyst?
SQL is an important skill for many data analyst roles because business data is often stored in relational databases. Learning SQL should therefore be a priority for most aspiring analysts.
Can I learn data analytics without programming?
Yes. You can begin with Excel, SQL, statistics, and visualization tools. Python is worth adding later because it can expand your ability to automate tasks and perform more complex analysis.
What tools should a beginner data analyst learn?
A practical starting combination is Excel + SQL + Power BI or Tableau. Once you are comfortable with these, consider adding Python.
How do I get practical experience in data analytics?
Work with real or public datasets. Pick a business question, clean the data, analyze it, create visualizations, and document your findings. Repeat the process with different datasets.
How many projects should I include in my portfolio?
There is no magic number, but three to five well-explained projects can provide a useful starting portfolio. Focus on demonstrating different skills and explaining your reasoning rather than producing a large collection of nearly identical dashboards.



_0011E4.webp)

No Comments Yet
Be the first to share your thoughts on this post!